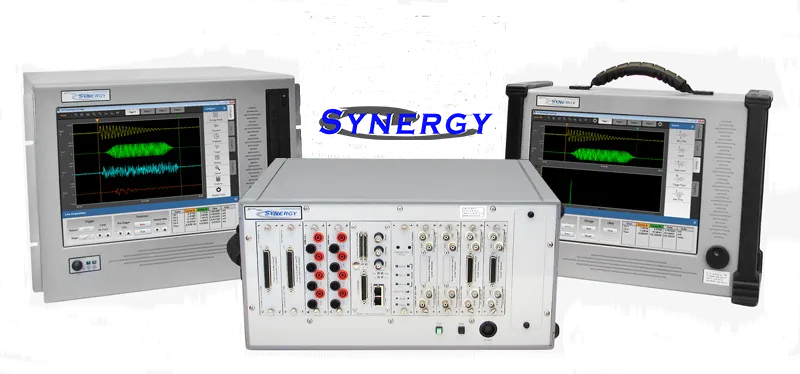
Synergy is a...
Enabling precision capture and analysis, Synergy features individual 16-bit digitizers per channel. Bandwidth up to 25 MHz enables collection of the fastest power transients, engine combustion cycles, pyroshock, ballistics and material test events. Up to 128 MS of transient RAM captures the longest event or thousands of shorter segments.
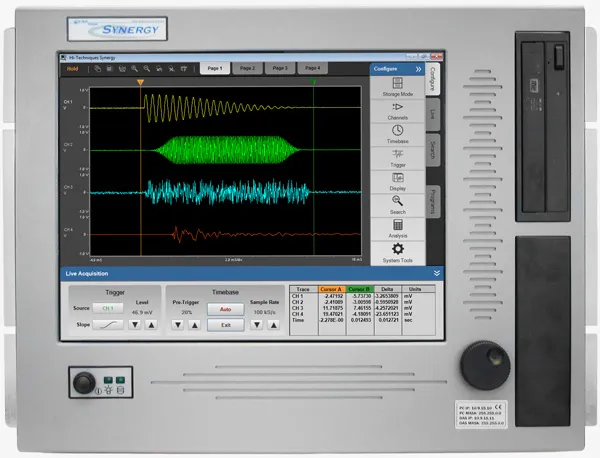
Featuring high resolution data capture, high speed direct-to-disk long duration recording and signal conditioning for most popular signal types.
Offering high speed, scrolling strip chart display, voice and trace annotation and integrated signal conditioning. Store and review literally months of data even at high acquisition rates.
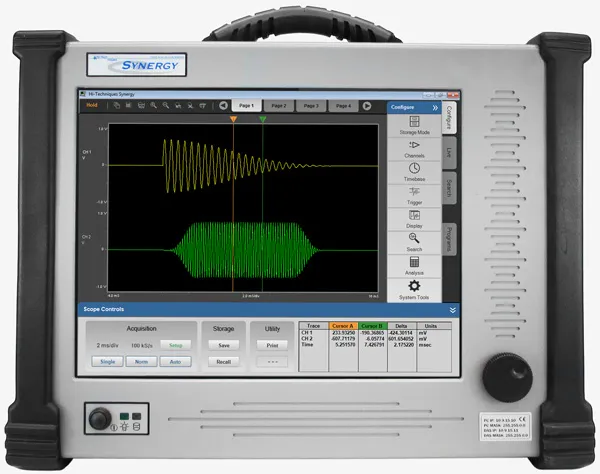
Featuring multi-channel independent 16-bit digitizing up to 100 MS/s, fast updated YT and XY scope displays and a wide variety of real-time parameter measurements as well as waveform calculations.
Including waterfall displays, octave and narrowband analysis, windowing and order analysis. Direct control from ME'scope® modal analysis software enabling setup and analysis for structural testing applications.